- Confidence in results: Validated for ChIP-seq with multiple transcription factors
- Proven: Validated by the epigenetics community, including the BLUEPRINT consortium
- Most complete kit available for highest quality data - includes control antibodies and primers
- Validated with Diagenode's MicroPlex Library Preparation™ kit and IP-Star® Automation System
ChIP-seq on cells
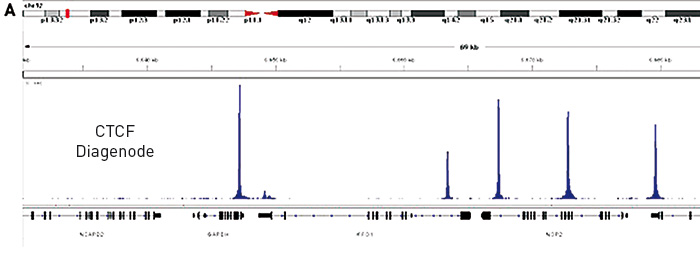
Figure 1. (A) Chromatin Immunoprecipitation has been performed using chromatin from HeLa cells, the iDeal ChIP-seq kit for Transcription Factors and the Diagenode ChIP-seq-grade CTCF antibody. The IP'd DNA was subsequently analysed on an Illumina® HiSeq. Library preparation, cluster generation and sequencing were performed according to the manufacturer's instructions. This figure shows the peak distribution in a region surrounding the GAPDH positive control gene.
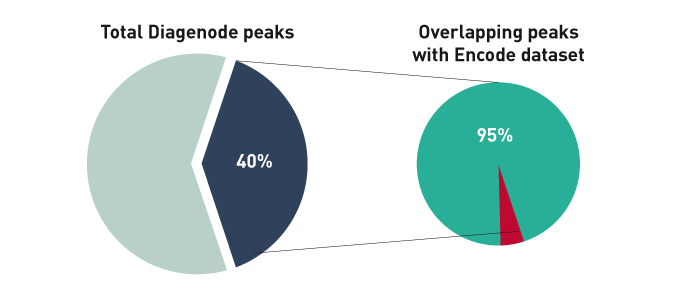
Figure 1B. The ChIP-seq dataset from this experiment has been compared with a reference dataset from the Broad Institute. We observed a perfect match between the top 40% of Diagenode peaks and the reference dataset. Based on the NIH Encode project criterion, ChIP-seq results are considered reproducible between an original and reproduced dataset if the top 40% of peaks have at least an 80% overlap ratio with the compared dataset.
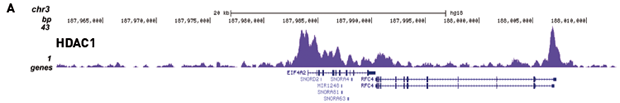
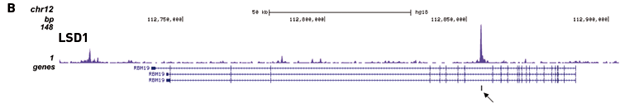
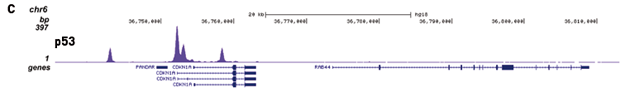
Figure 2. Chromatin Immunoprecipitation has been performed using chromatin from HeLa cells, the iDeal ChIP-seq kit for Transcription Factors and the Diagenode ChIP-seq-grade HDAC1 (A), LSD1 (B) and p53 antibody (C). The IP'd DNA was subsequently analysed on an Illumina® Genome Analyzer. Library preparation, cluster generation and sequencing were performed according to the manufacturer's instructions. This figure shows the peak distribution in regions of chromosome 3 (A), chromosome 12 (B) and chromosome 6 (C) respectively.
ChIP-seq on tissue
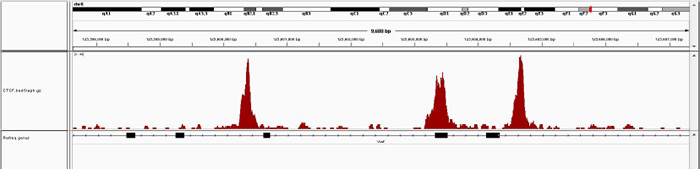
Figure 3A. Chromatin Immunoprecipitation has been performed using chromatin from mouse liver tissue, the iDeal ChIP-seq kit for Transcription Factors and the Diagenode ChIP-seq-grade CTCF antibody. The IP'd DNA was subsequently analysed on an Illumina® HiSeq. Library preparation, cluster generation and sequencing were performed according to the manufacturer's instructions. This figure shows the peak distribution in a region surrounding the Vwf positive control gene.

Figure 3B. The ChIP-seq dataset from this experiment has been compared with a reference dataset from the Broad Institute. We observed a perfect match between the top 40% of Diagenode peaks and the reference dataset. Based on the NIH Encode project criterion, ChIP-seq results are considered reproducible between an original and reproduced dataset if the top 40% of peaks have at least an 80% overlap ratio with the compared dataset.