Successful CUT&Tag results showing a low background with high region-specific enrichment are presented below. Chromatin profiling has been performed on 50,000 K562 cells, using the Diagenode’s iDeal CUT&Tag kit for Histones (Cat. No. C01070020), the Antibody Package for CUT&Tag anti rabbit (Cat. No. C01070022), the 24 UDI for Tagmented Libraries (Cat.No. C01011034) and H3K4me3 (Cat. No. C15410003), H3K27me3 (Cat. No. C15410069) or H3H9me3 antibodies (Cat. No., C15410193) as indicated. The libraries were sequenced on Illumina’s NovaSeq6000 in 2x50 bp mode.
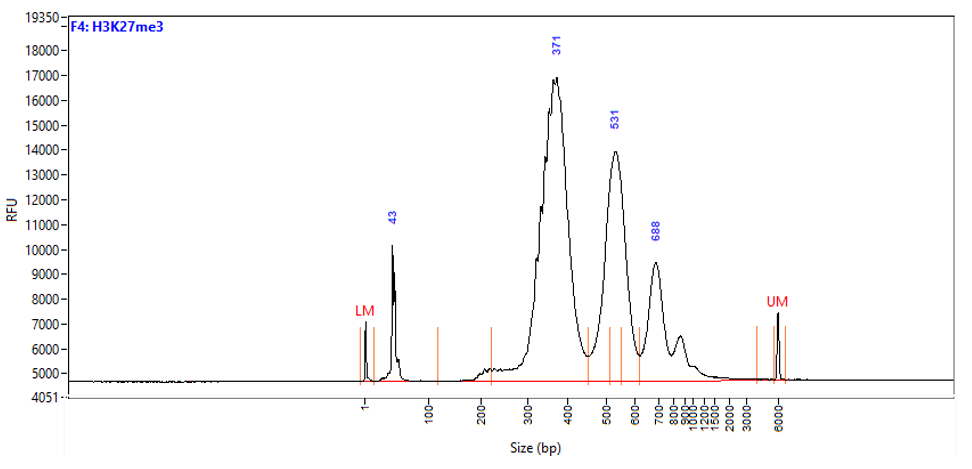
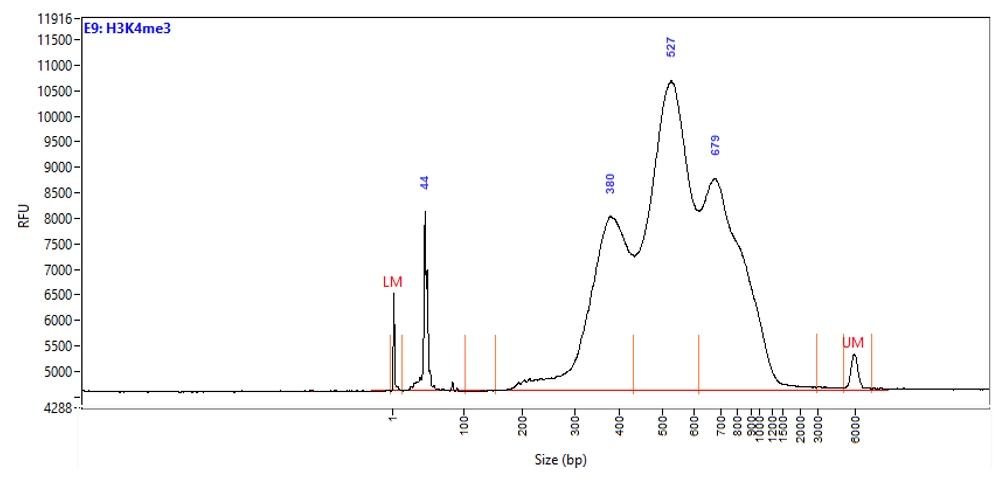
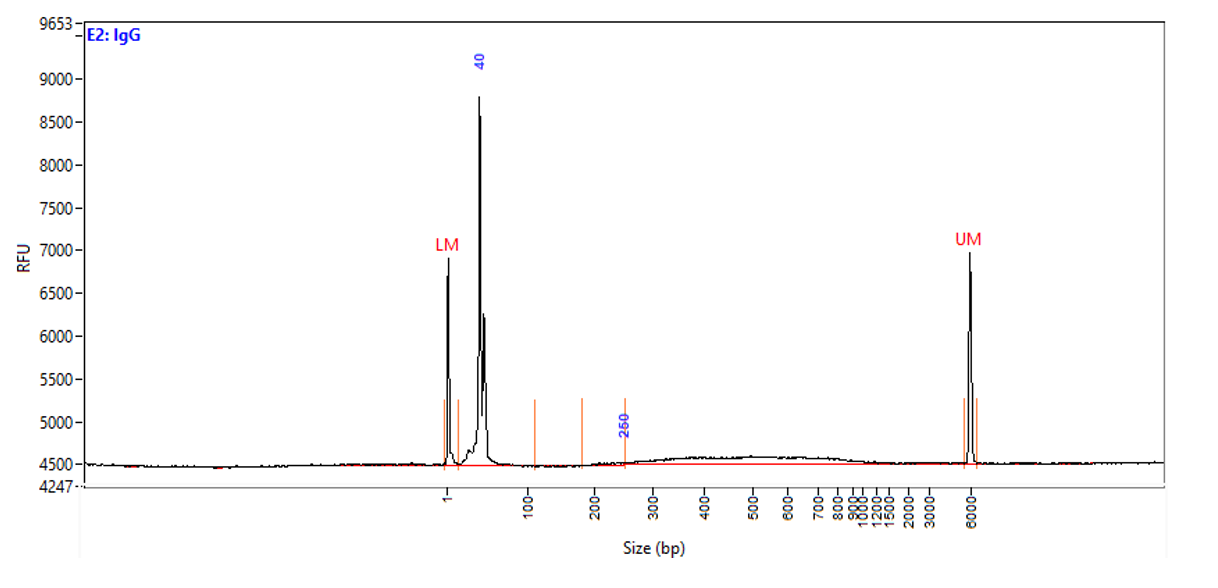
Figure 1. Typical library profiles (Agilent Fragment traces) generated by the iDeal CUT&Tag protocol using 50,000 K562 cells and H3K27me3 (top), H3K4me4 (middle) primary antibodies and IgG control (bottom). Sharp peak at around 40 bp is an excess of free oligonucleotide used for pA-Tn5 loading.
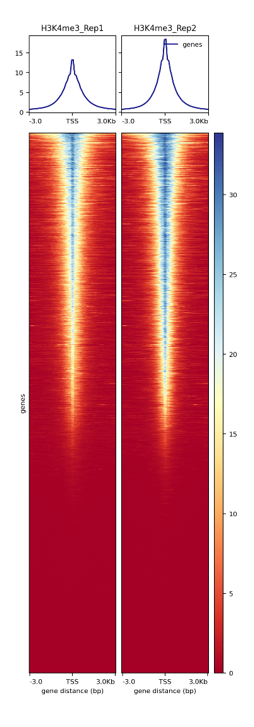
Figure 2. Enrichments at TSS of the CUT&Tag libraries. The heatmap shows the enrichment around 3kb upstream and downstream of the TSS for H3K4me3. H3K4me3 as an active chromatin mark is associated with active promoters shows a narrow enrichment pattern.
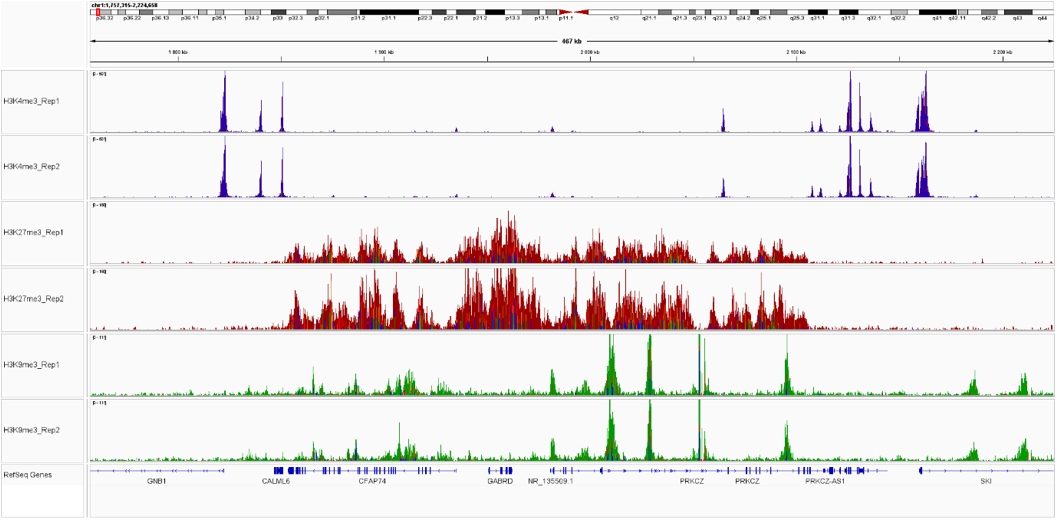
Figure 3. Sequencing profiles of the CUT&Tag libraries. Integrative genomics viewer (IGV) visualization of CUT&Tag experiments using 50,000 of K562 cells and H3K4me3 (blue), H3K27me3 (red) or H3K9me3 (green).
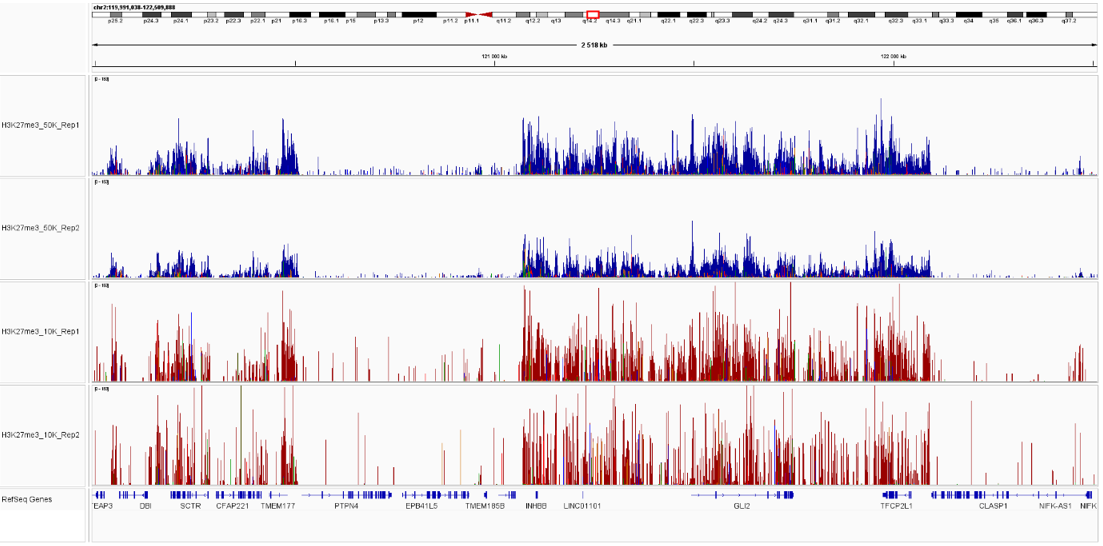
Figure 4. Sequencing profiles of the CUT&Tag libraries. Integrative genomics viewer (IGV) visualization of CUT&Tag experiments using 50,000 (blue) or 10,000 (red)) of K562 cells and H3K27me3 antibody.